Date Completed: November 20, 2002
The objective of this experiment is investigating the response of a system with velocity & position feedback and the effect of addition of a controller to this system.
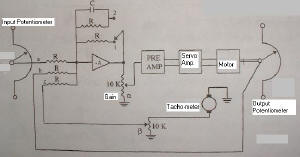
The output potentiometer shows the current angle (position) of the output, the input potentiometer specifies the desired angle which should be followed by the output potentiometer.
The mechanics of the whole system and the way each instrument is connected to the others is depicted in the figure below:
The above system can be shown in block diagram form in this way:
Parameter definitions:
(Ke) is proportion coefficient between angles and related voltages in the potentiometers, which in this system measures 0.1.
(K) is the gain of the cascade of Op-Amp, α and Pre-Amp unit, which measures :
Zf/R *32*α
(Km) and (Tm) are related to approximate system function of Motor and are 433 and 1.34 respectively.
(N) is a proportion coefficient by which the speed of Motor has been reduced to read the output potentiometer and is 30.
(Kg) is again a proportion coefficient by which the voltage of Tachometer is related to the speed of Motor : Vt=Kg*Speed and measures 0.00254 v/rpm
Note:
Due to lack of a data acquisition card, the results of this experiment couldn't be directly imported from Oscilloscope to a PC for demonstration and analysis. So I've used Control System Toolbox of Matlab Package (www.mathworks.com) in order to simulate the same system in PC and therefore achieving the same wave shapes.
The Effect of Velocity feedback:
(The switch in the output of Op-Amp is in position one, therefore Zf=R and K=32*α) According to the previous block diagram, the transfer function is:
θo/θi=34.5α/(s^2 + 9.1αβs + 34.5α)
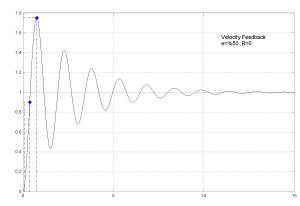
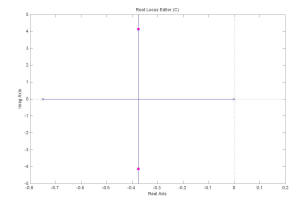
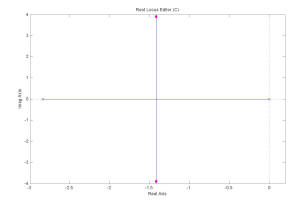
If β=0 & α=%50 :
The step response is :
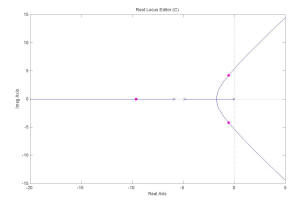
and the system Root Locus is:
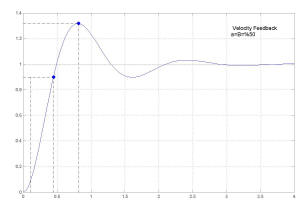
If β=%50 & α=%50:
The step response is:
and the system Root Locus is:
Considering above responses, it can be seen that when the velocity feedback is applied, β=%50, the response is more damping, the overshoot is less and the rise-time is greater.
The Effect of Using a Controller & Velocity feedback:
(The switch in the output of Op-Amp should be in position two now, therefore Zf=R||C and K=32*α/(RSC+1)) , RC=0.1 Sec
According to the previous block diagram, the transfer function is:
θo/θi=344.5α/(s^3 + 10.7s^2 + (7.5+83.5αβ)s + 344.5α)
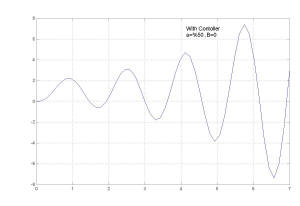
If β=0 & α=%50 :
The step response is :
and the system Root Locus is:
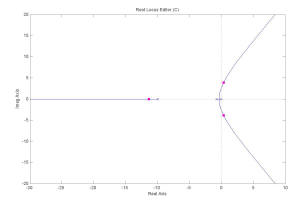
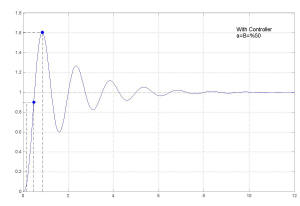
If β=%50 & α=%50:
The step response is:
and the system Root Locus is:
Considering the above responses, it can be seen that when the velocity feedback is applied, β=%50, the response is stable. It can be seen from the transfer function that because of the controller used, a pole is added to system and therefore in some gains, the system may become unstable like the above case, and by using the controller, the system can retain its stability.
Many parts of the actual experiment has been eliminated due to time limitation for its documentation. Of course, I've tried to preserve the main concept of the experiment.
Simulink 5.0 Model
Matlab figures/Workspace Variables used in this project
